How we helped a DTC activewear brand grow revenue 67% year over year
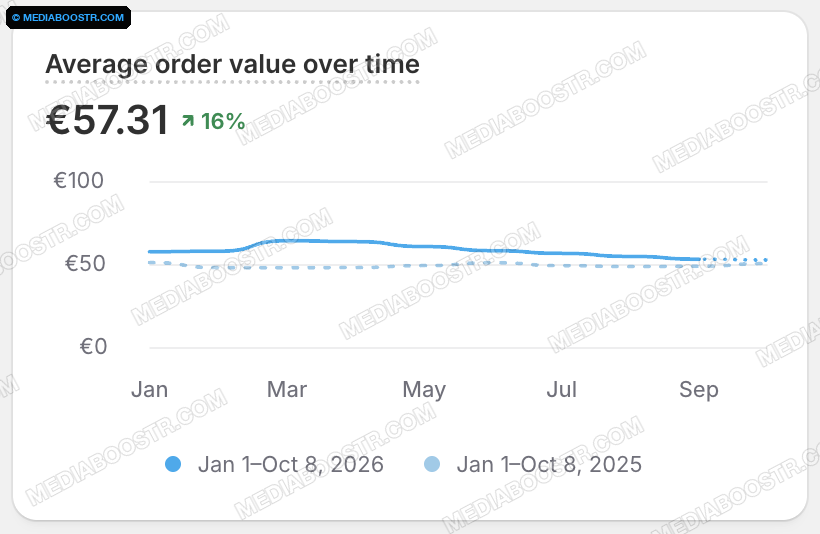
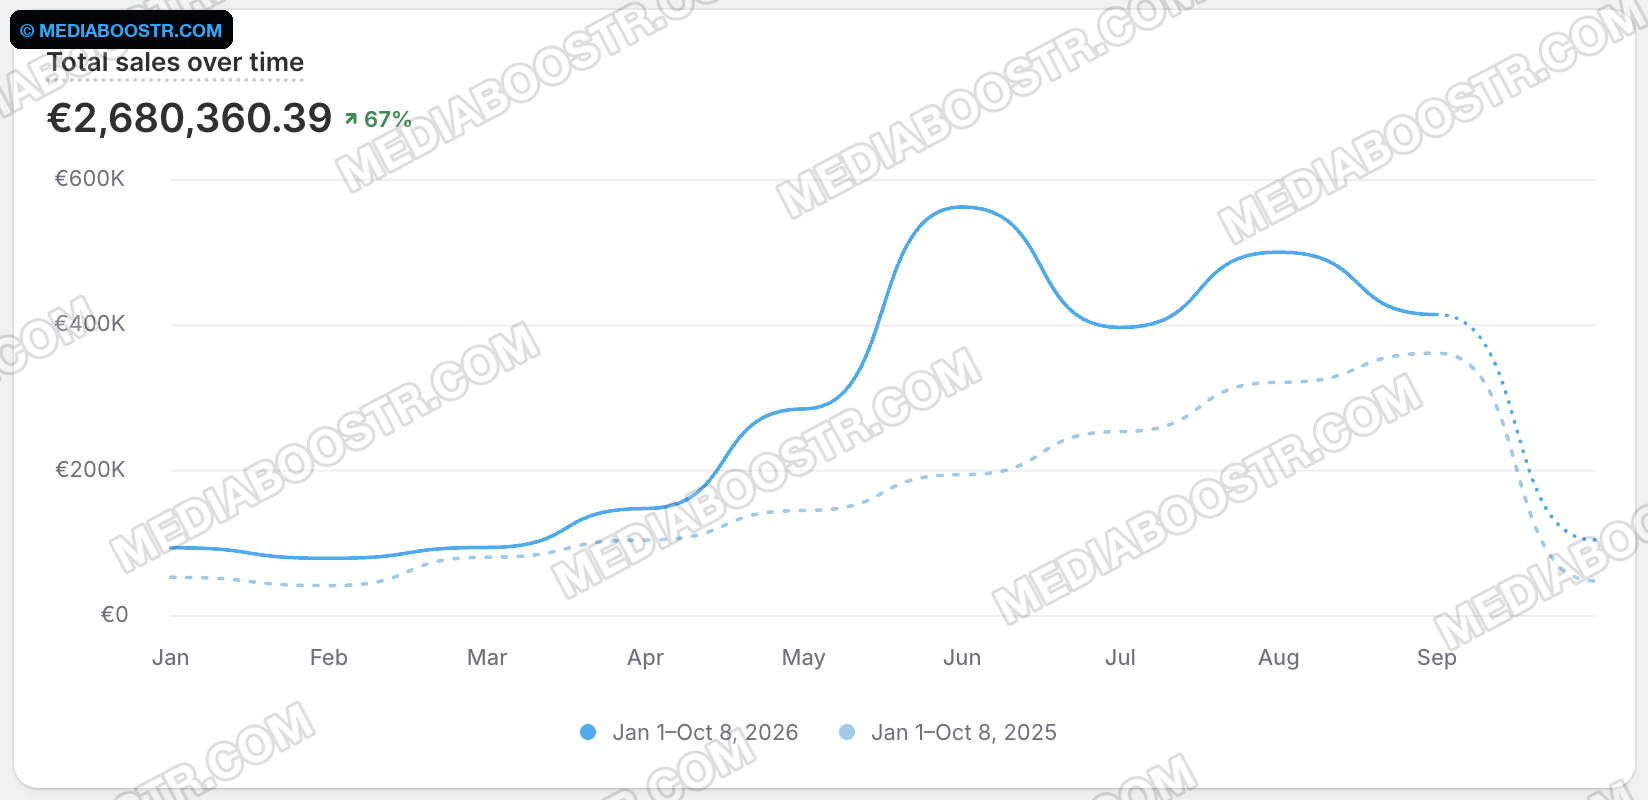
In the first nine months of 2026 the store sold €2.68M, 67% more than in the same months of 2025. Orders got bigger too: average order value rose 16% to €57.31. Here is what we changed in the ads, the offer and the pages to get there.
At a glance
MediaBoostr helped a direct-to-consumer activewear brand in the DACH region grow online revenue to €2,680,360 between January 1 and October 8, 2026, up 67% on the same period of 2025. Monthly revenue went from under €100K in January to more than €500K in June. Average order value rose 16% to €57.31. We have run the brand's ads, offers and pages since March 2025.
- Brand
- DTC activewear
- Market
- DACH (Germany, Austria, Switzerland)
- Period
- Jan 1 to Oct 8, 2026 vs. same period 2025
- Channels
- Mostly Meta, some Google
- Services
- Ads, offers, pages
The starting point
In 2025 the store grew month by month, from about €50K in January to around €350K in September (read from the dashed line in the chart below). We started with the brand in March 2025, so most of the 2025 line already includes our first year of work. 2026 is year two. The problem: the brand sold well to people who already knew it, but it could not scale into cold traffic. New customers cost too much to make growth pay.
1. A new ad account structure
We rebuilt the ad account from the ground up. New concepts went into a testing campaign first, so each idea got a fair read on a small budget. The ads that won there moved into one scalable campaign with campaign budget optimization (CBO), and that is where we raised spend. Testing kept finding new winners; the scaling campaign put money behind them.
2. Bigger orders
Average order value rose from about €49 to €57.31 (Shopify shows +16%). It stayed above last year's line in every month on the chart. Two changes did it together: a new offer, and a new product page design built to sell that offer visually. The offer was a bundle. Instead of trying to look cheap, it gave customers the set that suited them best, and the new page made the bundle easy to see and choose.
The results
- Online revenue of €2,680,360 from January 1 to October 8, 2026, up 67% on the same period of 2025.
- Monthly revenue from under €100K in January to more than €500K in June.
- Average order value up 16% to €57.31.
What to take from this
- The offer and the page work as one. A new offer only lifted order value once the product page showed it clearly.
- Bigger orders let you buy more traffic. Each customer is worth more, so you can pay more to reach new ones.
- Pay for acquisition on the first order. For most brands the biggest cost is getting a new customer. A bundle that makes the first order profitable beats a discount that only makes you look cheap.